News Next article
Southland and small homes lead property price growth
Property Pulse Report - April 2026
By Gavin Lloyd 8 May 2026
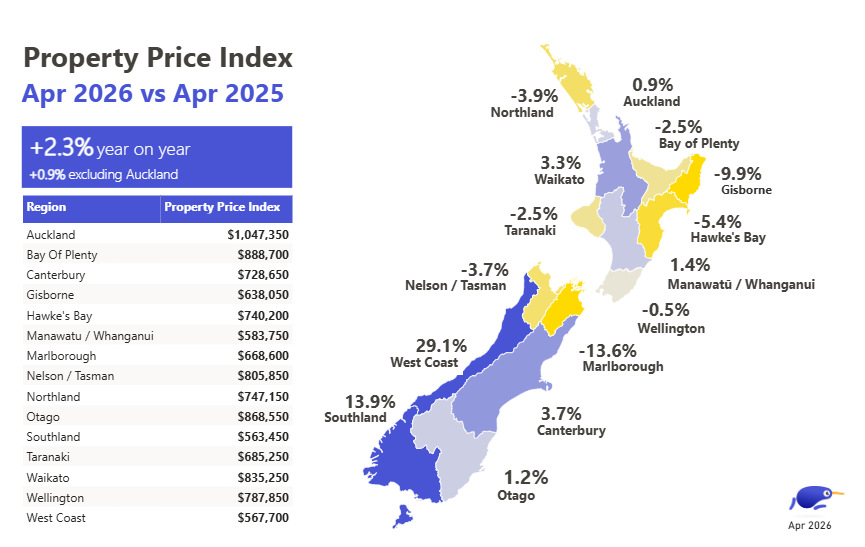
Property prices April 2025 - April 2026
Regional standouts and market volatility
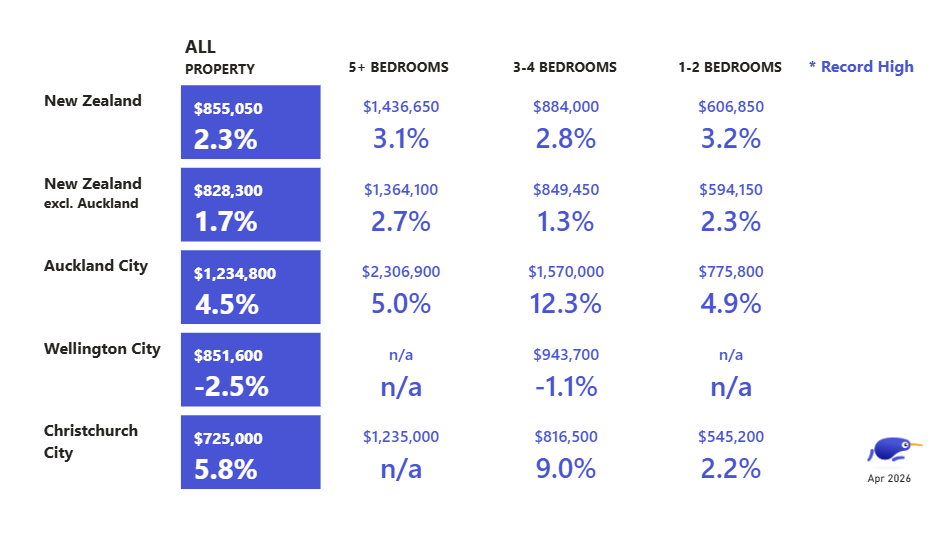
Small homes find their stride
| Region | Property Price Index | YoY % change | |||
|---|---|---|---|---|---|
| Auckland | Auckland | $1,047,350 | $1,047,350 | 0.9% | 0.9% |
| Bay of Plenty | Bay of Plenty | $888,700 | $888,700 | -2.5% | -2.5% |
| Canterbury | Canterbury | $728,650 | $728,650 | 3.7% | 3.7% |
| Gisborne | Gisborne | $638,050 | $638,050 | -9.9% | -9.9% |
| Hawke's Bay | Hawke's Bay | $740,200 | $740,200 | -5.4% | -5.4% |
| Manawatuū/Whanganui | Manawatuū/Whanganui | $583,750 | $583,750 | 1.4% | 1.4% |
| Marlborough | Marlborough | $668,600 | $668,600 | -13.6% | -13.6% |
| Nelson/Tasman | Nelson/Tasman | $805,850 | $805,850 | -3.7% | -3.7% |
| Northland | Northland | $747,150 | $747,150 | -3.9% | -3.9% |
| Otago | Otago | $868,550 | $868,550 | 1.2% | 1.2% |
| Southland | Southland | $563,450 | $563,450 | 13.9% | 13.9% |
| Taranaki | Taranaki | $685,250 | $685,250 | -2.5% | -2.5% |
| Waikato | Waikato | $835,250 | $835,250 | 3.3% | 3.3% |
| Wellington | Wellington | $787,850 | $787,850 | -0.5% | -0.5% |
| West Coast | West Coast | $567,700 | $567,700 | 29.1% | 29.1% |
Explore Past Property Market Reports
Most properties, more choice
Explore endless possibilities on NZ's favourite property app.
Download for iOS Download for Android 
Author
Other news you might like