News Next article
Spring market hits as buyer activity and listings soar
Property Pulse Report - October 2025
By Gavin Lloyd 6 November 2025
A surge in new listings
Asking prices up across the motu
| Region | Property Price Index | YoY % change | |||
|---|---|---|---|---|---|
| Auckland | Auckland | $1,024,850 | $1,024,850 | -1.8% | -1.8% |
| Bay of Plenty | Bay of Plenty | $864,150 | $864,150 | -4.8% | -4.8% |
| Canterbury | Canterbury | $722,500 | $722,500 | -1.1% | -1.1% |
| Gisborne | Gisborne | $618,850 | $618,850 | -6.8% | -6.8% |
| Hawke's Bay | Hawke's Bay | $753,050 | $753,050 | 1.1% | 1.1% |
| Manawatuū/Whanganui | Manawatuū/Whanganui | $584,850 | $584,850 | -0.6% | -0.6% |
| Marlborough | Marlborough | $724,800 | $724,800 | -9.3% | -9.3% |
| Nelson/Tasman | Nelson/Tasman | $810,350 | $810,350 | 2.1% | 2.1% |
| Northland | Northland | $764,100 | $764,100 | -7.4% | -7.4% |
| Otago | Otago | $879,550 | $879,550 | 4.1% | 4.1% |
| Southland | Southland | $539,150 | $539,150 | 9.7% | 9.7% |
| Taranaki | Taranaki | $674,300 | $674,300 | 9.5% | 9.5% |
| Waikato | Waikato | $815,000 | $815,000 | 0.4% | 0.4% |
| Wellington | Wellington | $779,300 | $779,300 | -2.5% | -2.5% |
| West Coast | West Coast | $493,350 | $493,350 | 8.9% | 8.9% |
Annual change in the Property Price Index
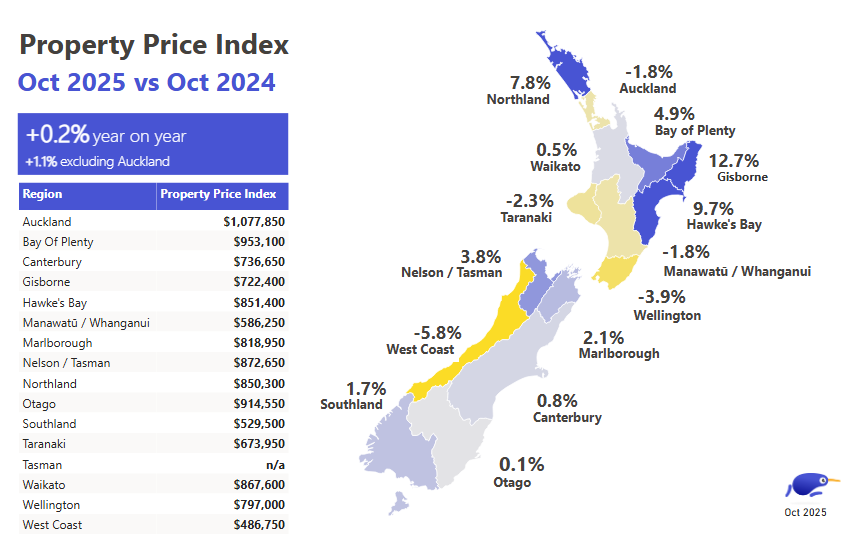
Up +0.2% year-on-year
Days onsite tumble
| Region | Property Price Index | YoY% change | |||
|---|---|---|---|---|---|
| Auckland | Auckland | $1,077,950 | $1,077,950 | -1.8% | -1.8% |
| Bay of Plenty | Bay of Plenty | $953,100 | $953,100 | 4.9% | 4.9% |
| Canterbury | Canterbury | $736,650 | $736,650 | 0.8% | 0.8% |
| Gisborne | Gisborne | $722,400 | $722,400 | 12.7% | 12.7% |
| Hawke's Bay | Hawke's Bay | $851,400 | $851,400 | 9.7% | 9.7% |
| Manawatu/Whanganui | Manawatu/Whanganui | $586,250 | $586,250 | -1.8% | -1.8% |
| Marlborough | Marlborough | $818,950 | $818,950 | 2.1% | 2.1% |
| Nelson/Tasman | Nelson/Tasman | $872,650 | $872,650 | 3.8% | 3.8% |
| Northland | Northland | $850,300 | $850,300 | 7.8% | 7.8% |
| Otago | Otago | $914,550 | $914,550 | 0.1% | 0.1% |
| Southland | Southland | $529,500 | $529,500 | 1.7% | 1.7% |
| Taranaki | Taranaki | $673,950 | $673,950 | -2.3% | -2.3% |
| Waikato | Waikato | $867,600 | $867,600 | 0.5% | 0.5% |
| Wellington | Wellington | $797,000 | $797,000 | -3.9% | -3.9% |
| West Coast | West Coast | $486,750 | $486,750 | -5.8% | -5.8% |
Explore Past Property Market Reports
Most properties, more choice
Explore endless possibilities on NZ's favourite property app.
Download for iOS Download for Android 
Author